
DockerCompose runs Grafana and integrates Prometheus+node-exporter+cadvisor multiple server performance monitoring
Use docker to run Grafana to integrate Prometheus+node-exporter+cadvisor to monitor multiple nodes.
One of the nodes is the local machine, and the other is my other server. Prometheus only needs to start one, and the other server only needs to run a node-exporter.
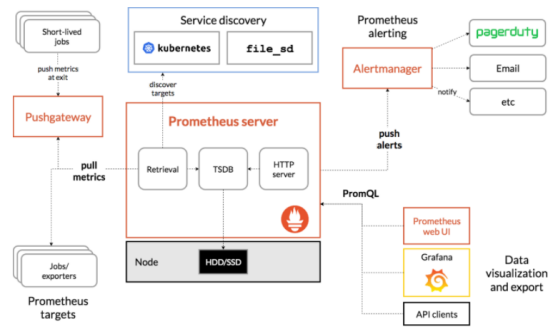
The official Prometheus and some third parties have already made the collection of index data of some commonly used databases, systems, middleware, etc. into exporters, which can be directly imported and used in the production environment. In this section, we will use the Node Exporter officially provided by Prometheus to collect the running data of the Linux system. cAdvisor can perform real-time monitoring and performance data collection of resources and Docker containers on node machines, including CPU usage, memory usage, network throughput, and file system usage.
This article is based on docker-compse. If there is no docker environment, please prepare the docker environment first.
docker-compose file preparation
1.When writing the grafana.yml file, you must remember to mount it on the volume, otherwise you will have to reconfigure it after restarting.
version: '3.1'
services:
 grafana:
   image: grafana/grafana
   container_name: grafana
   restart: always
   ports:
    - "3000:3000"
   volumes:
    - /opt/grafana:/var/lib/grafana
2.Write prometheus.yml to include Prometheus+node-exporter+cadvisor
version: "3"
services:
    prometheus:
        image: prom/prometheus
        container_name: prometheus
        hostname: prometheus
        restart: always
        volumes:
            - /opt/prometheus/config/prometheus.yml:/etc/prometheus/prometheus.yml
            - /opt/prometheus/config/node_down.yml:/etc/prometheus/node_down.yml
        ports:
            - "9090:9090"
    node-exporter:
        image: quay.io/prometheus/node-exporter
        container_name: node-exporter
        restart: always
        ports:
            - "9100:9100"
    cadvisor:
        image: google/cadvisor:latest
        container_name: cadvisor
        restart: always
        volumes:
            - /:/rootfs:ro
            - /var/run:/var/run:rw
            - /sys:/sys:ro
            - /var/lib/docker/:/var/lib/docker:ro
        ports:
            - "8080:8080"
3.Another node, node-exporter.yml
version: '3.1'
services:
  node-exporter:
     image: quay.io/prometheus/node-exporter
     container_name: node-exporter
     restart: always
     ports:
      - "9100:9100"
Prometheus configuration file editing
The files mounted by prometheus above have two prometheus.yml and node_down.yml
1.prometheus.yml
172.18.0.1 is the gateway address of my docker network card. The port corresponds to the address configured in the docker-compose file above, and all the default ports are used here.
# my global config
global:
  scrape_interval:     15s # Set the scrape interval to every 15 seconds. Default is every 1 minute.
  evaluation_interval: 15s # Evaluate rules every 15 seconds. The default is every 1 minute.

#alerting:
 # alertmanagers:
 # - static_configs:
 #   - targets: ['172.18.0.1:9093']

rule_files:
  - "node_down.yml"

scrape_configs:
  - job_name: 'prometheus'
    static_configs:
    - targets: ['172.18.0.1:9090']

  - job_name: 'cadvisor'
    static_configs:
    - targets: ['172.18.0.1:8080']

  - job_name: 'node'
    scrape_interval: 8s
    static_configs:
      - targets: ['172.18.0.1:9100','49.235.160.131:9100']
2.node_down.yml
groups:
- name: node_down
  rules:
  - alert: InstanceDown
    expr: up == 0
    for: 1m
    labels:
      user: test
    annotations:
      summary: "Instance {{ $labels.instance }} down"
      description: "{{ $labels.instance }} of job {{ $labels.job }} has been down for more than 1 minutes."
Start service
docker-compose -f grafana.yml up -d

docker-compose -f node-exporter.yml up -d

docker-compose -f prometheus.yml up -d
Configuration interface
Visit your grafana after startup, the address is ip:3000, you need to modify the default password (admin/admin) for the first time.
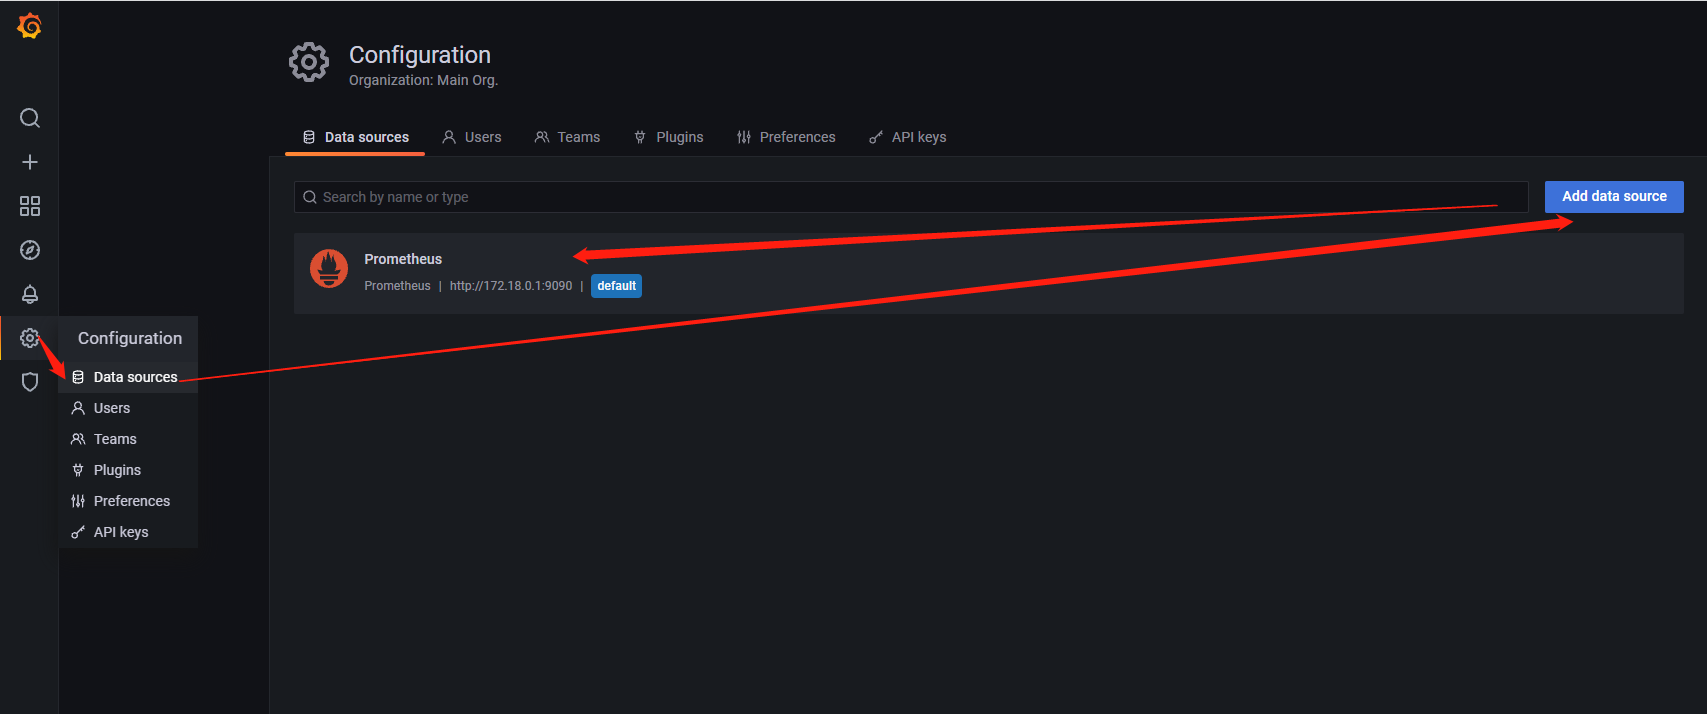
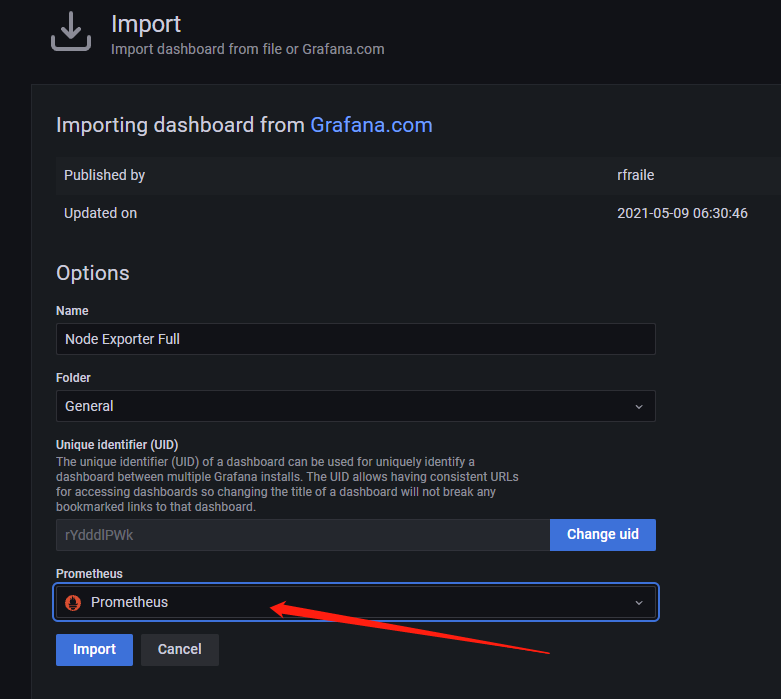
After logging in, the first step is to add the prometheus data source.
The second step is to find an official template, template ID: 1860, of course, you can also design your own dashboard.
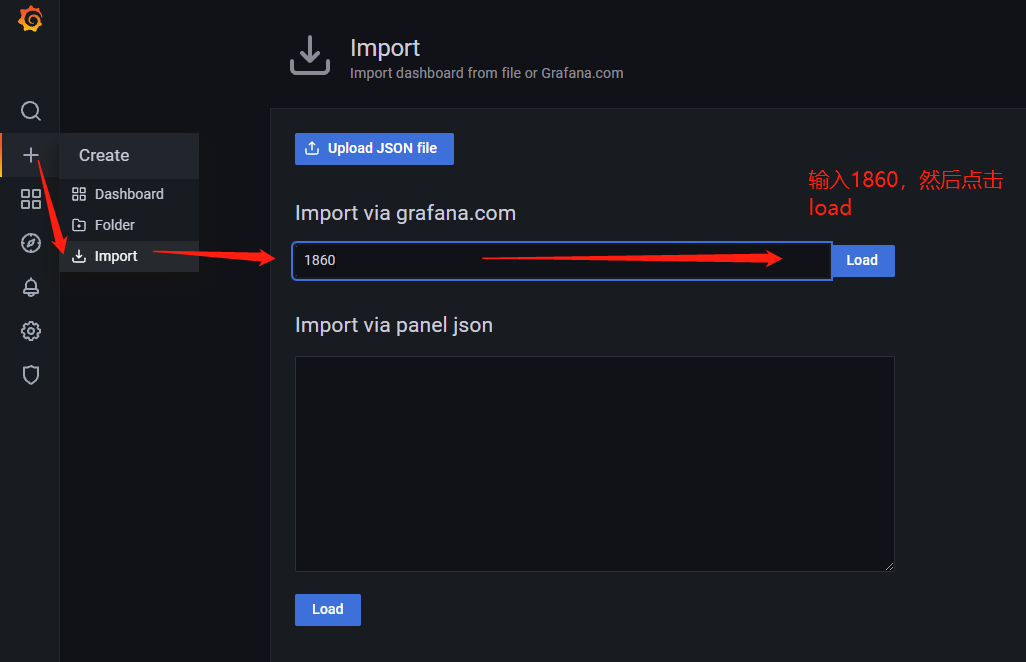
Here you need to select the data source set in the first step.
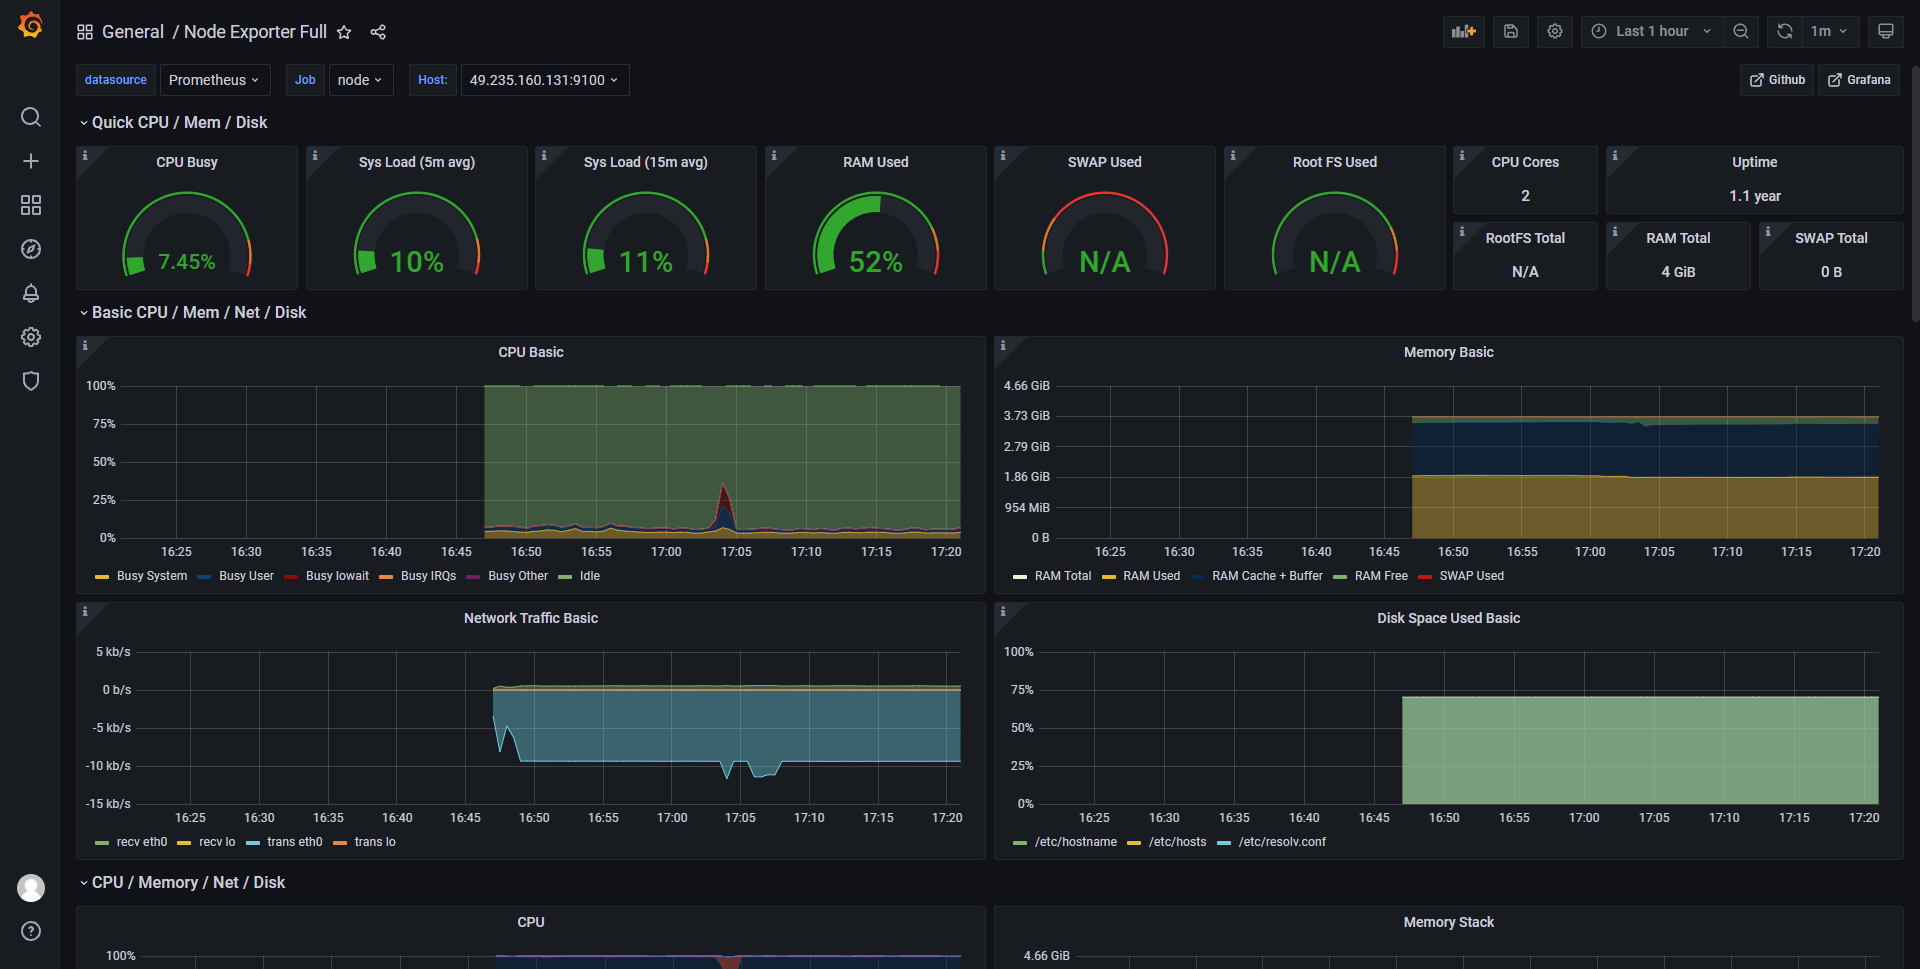
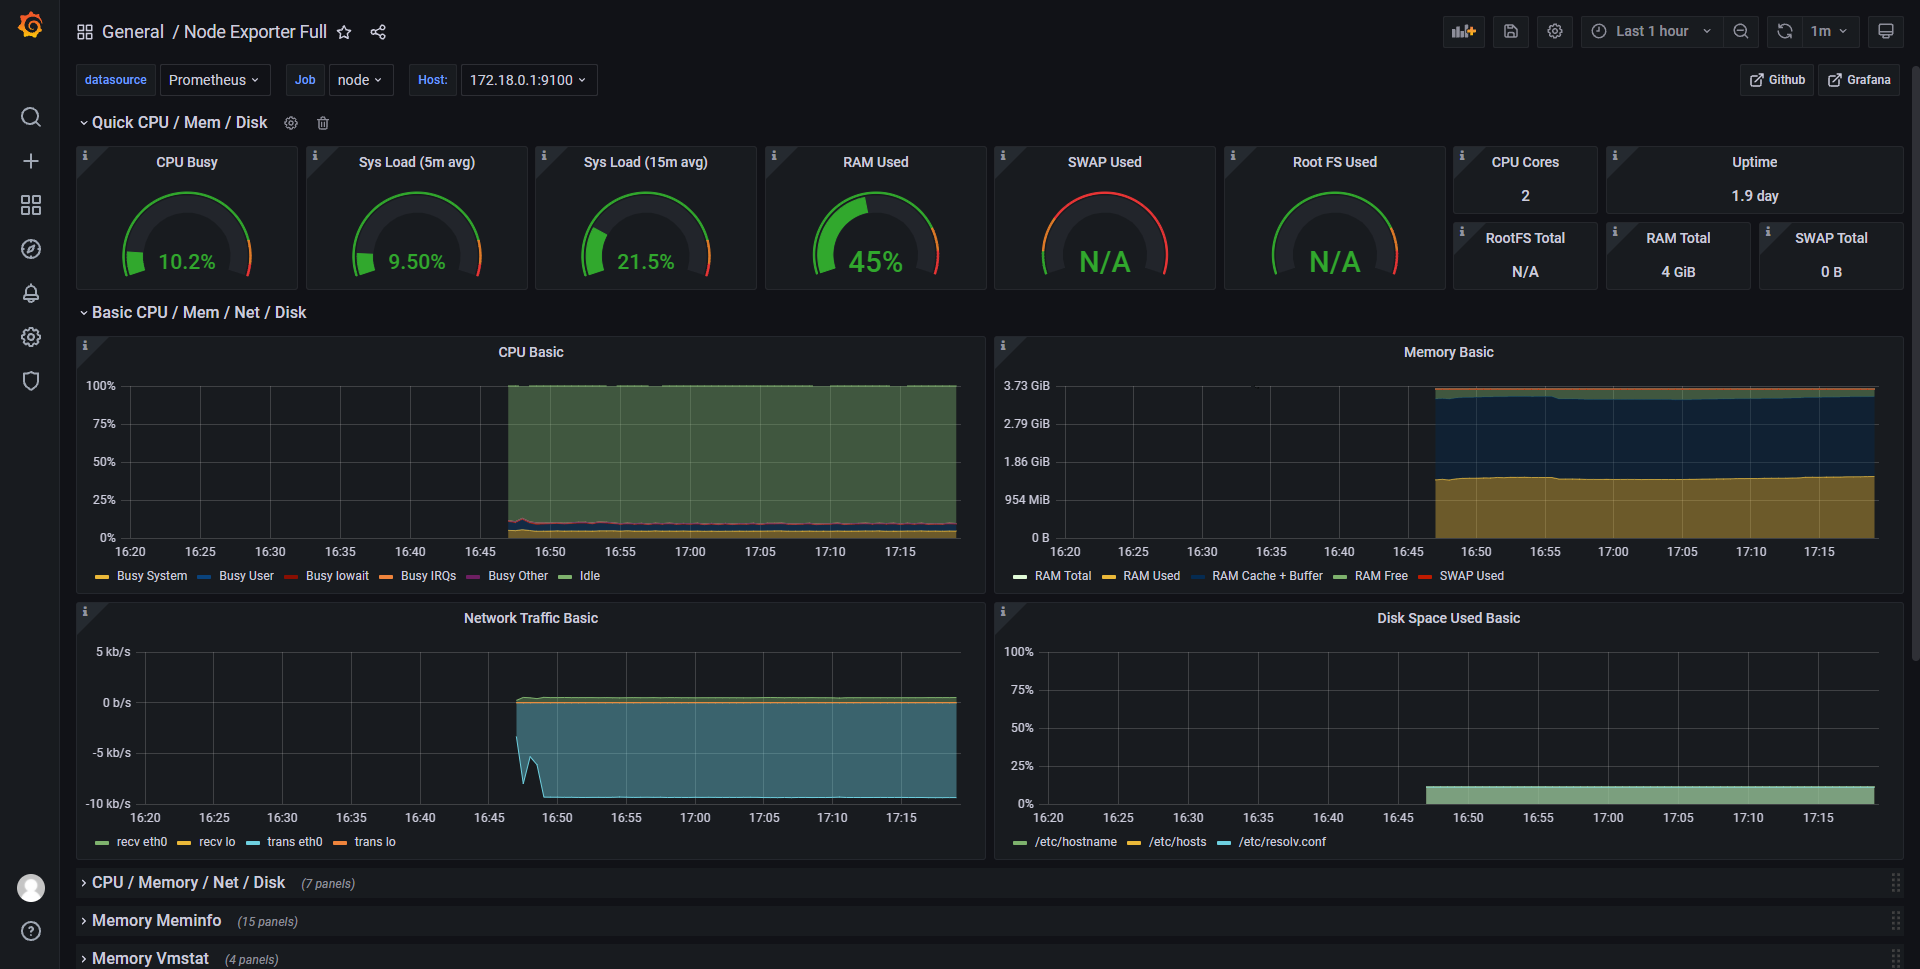
actual effect
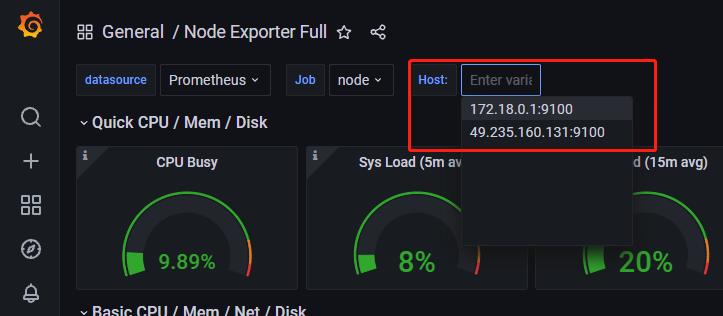
View other server information
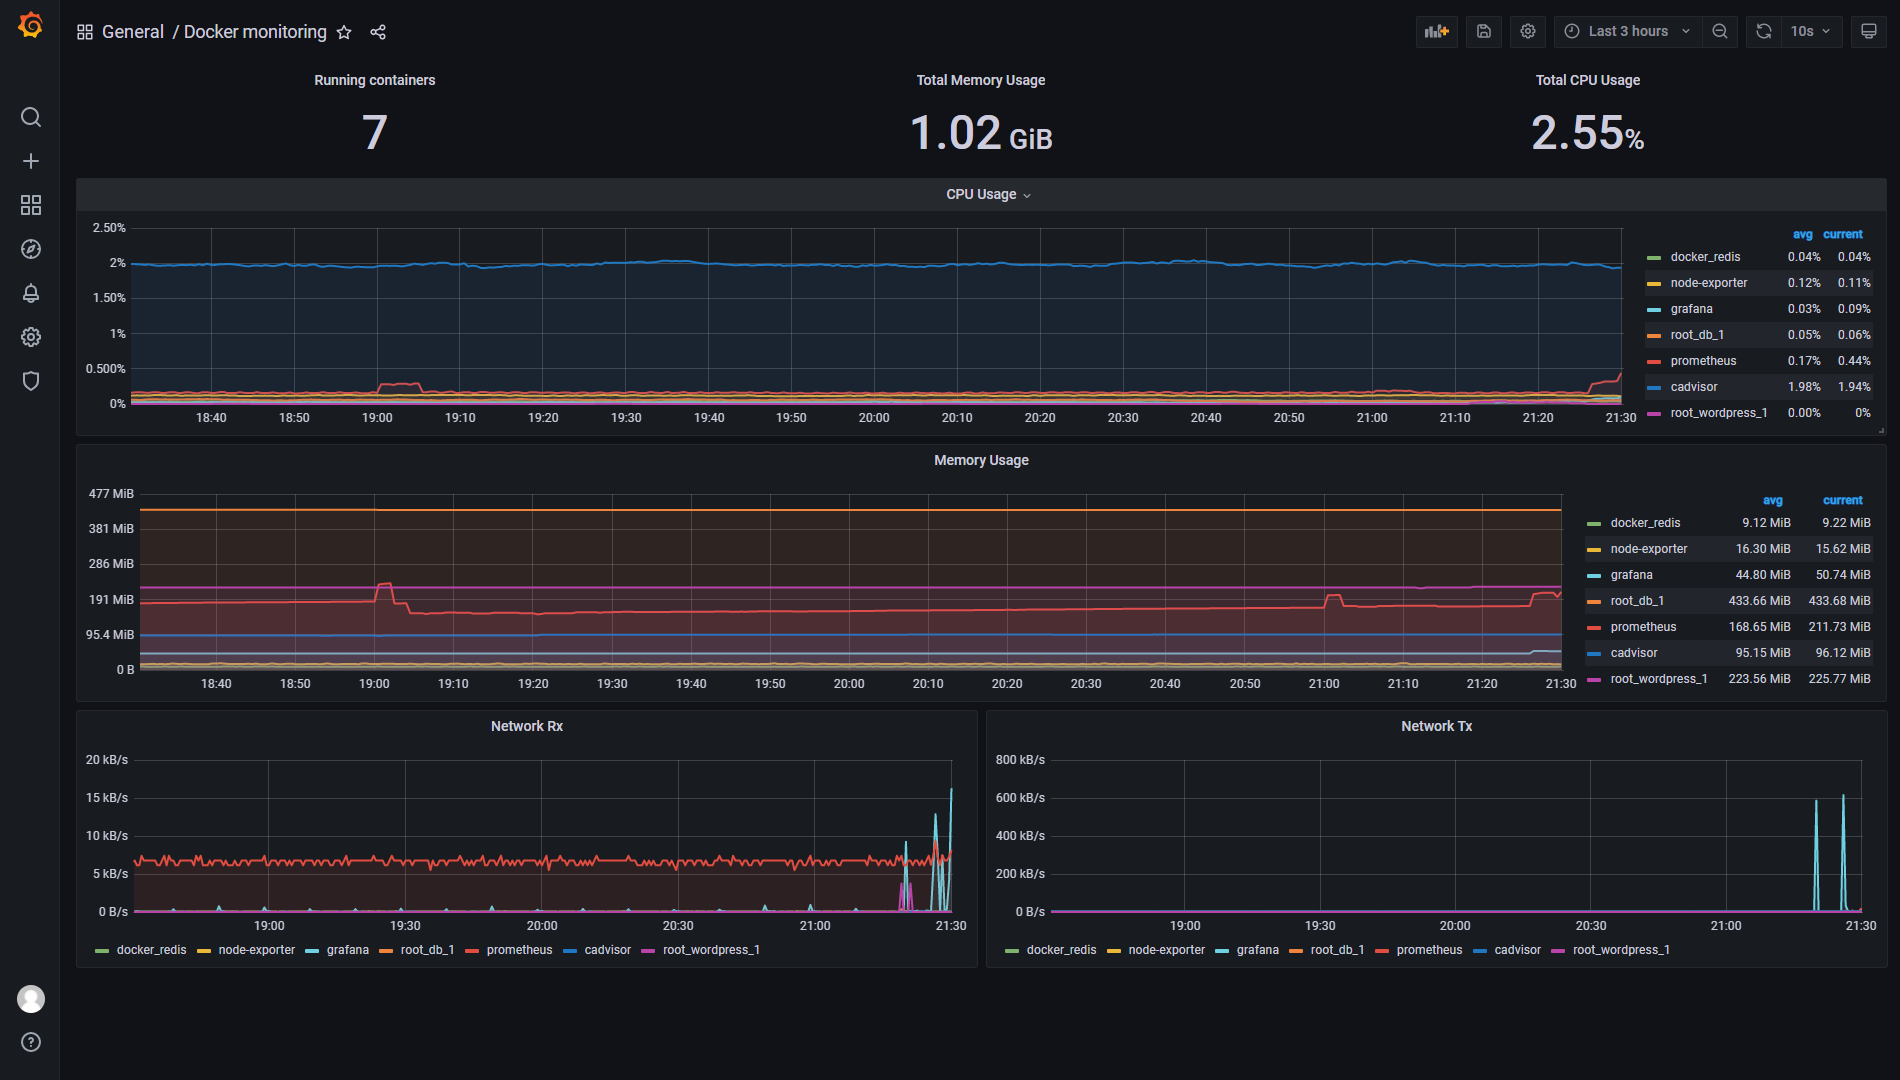
Monitoring Docker host template ID: 193 (this template can be used directly to monitor docker to get the dashboard)


发表评论